For a long time, statistics has had a reputation for wiping out individuality, for describing aggregates only through sums and averages. However, in the 1960s, especially in France, techniques of descriptive statistical analysis were developed, (Jean-Paul Benzecri’s correspondence analysis) permitting us to focus on individuals within the larger totality. Since then, developments in information technology and the proliferation of quasi-automatic recording (wanted or unwanted) of data from individuals have resulted in techniques known as data-mining and profiling; shining a light on individuals, for example, to identify future delinquents or simply profile consumers. Statistics has thus constructed an all the more dense network of relations that permits us to make connections between individuals and larger aggregates. Among these mathematical and statistical tools, those most widespread and widely taught are known for their ability to estimate size, draw inferences, and test hypotheses, due notably to the calculation of probabilities. Here we present an altogether different group of tools, more descriptive than inferential, the benefit of which includes the possibility of creating a back and forth between individuals and synthetic representations – obviously something of great interest to political scientists and sociologists.[1]
Belgian astronomer Adolphe Quetelet (1796-1874) introduced to the human sciences the idea of the average man, of the regularity and predictability of average behaviors, as opposed to individual behaviors, which are random and especially unpredictable. When human traits, such as size, become “normally” distributed, say according to a bell curve, their average supposedly represents a superior ontological reality, a whole comprised of specific properties, distinct individual cells. This idea would be the basis of future quantitative social sciences, Emile Durkheim’s Le Suicide being the prototype: sociology is not the uniting of individual psychologies.
Then, at the end of the 19th century, biometricians (and eugenicists) Francis Galton (1822-1911) and Karl Pearson (1857-1936), who touted the idea of inherited biological and intellectual human traits, became interested not only in averages, but also in differences – in the dispersion and distribution of said traits. The individual was indirectly reintroduced, permitting us to locate her along the scale, in space, all while explaining the notion of “correlation” between these traits and the notion of “regression”—formalizing the effects of one “variable” upon another. But, by focusing on distributions rather than on averages, these new tools introduced the idea of “variation” and eventually “explained variation,” and in doing so the individual was temporarily back in a trap. Yet these notions of correlation and regression, the foundations of statistical mathematics, had a very promising future in econometrics, social sciences, and social engineering.
Psychologists Alfred Binet, Charles Spearman, and Louis Léon Thurstone would revive these tools in order to evaluate individuals within larger and more complex spaces through the concept of general intelligence. The factorial analysis of psychologists (principal component analysis), makes visible such multidimensional spaces, but until the 1960s, it was used in psychology much more often than in the other social sciences (political science, sociology, economics).
Data analysis à la française…
At that time in France a new, multidimensional, analytical tool was put in place by a unique and charismatic statistician, Jean-Paul Benzecri. Called correspondence analysis, it quickly met with success among French sociologists, notably Pierre Bourdieu. It was such a hit because the “fields” of Bourdieu’s theory could be represented on cards – graphics with a maximum amount of information contained in a table with a multitude of lines and columns. The cards might note the relative positions of specific individuals or the centers of gravity for clouds of points corresponding to a specific category, for example the employers and bishops in Bourdieu’s famous articles. What’s more, they’re called “dual” analyses: they can show “points/lines” or “points/columns” simultaneously, so that in a single glance, one can see the relative positions of individuals or groups, as well as the variables they represent.
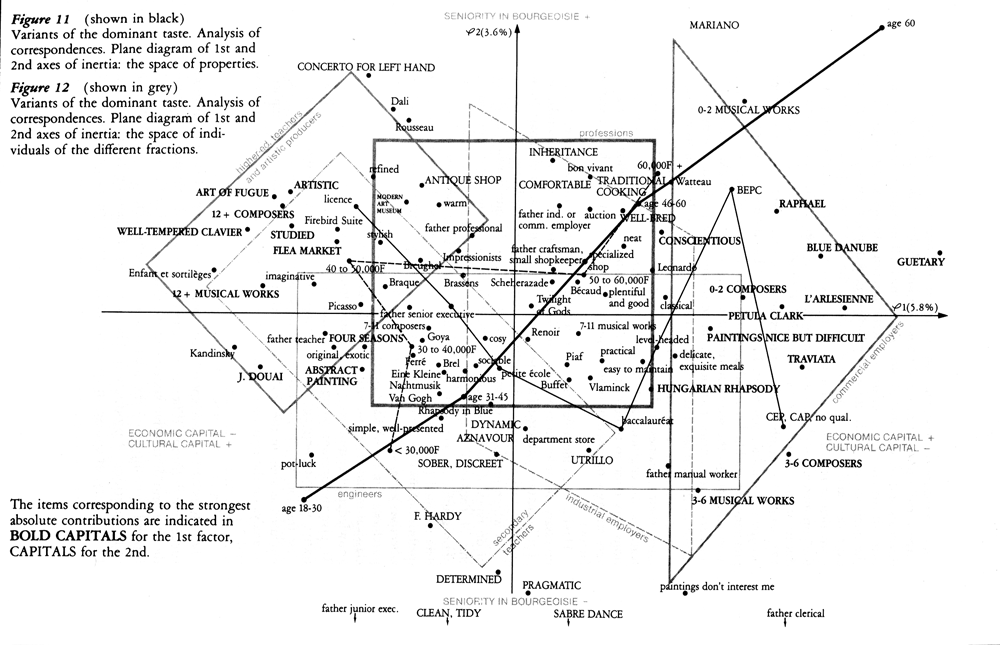
Illustration (with explanations) from Routledge’s 2002 edition of Distinction by Pierre Bourdieu.
This French-style correspondence analysis was thought by some to be a child of May ‘68. As it spread through the social sciences around 1970, it was considered “leftist” just as econometric techniques, one the other hand, were thought of as “rightist.” Today this seems strange: statistical tools by themselves are neither “leftist” nor “rightist.” How can one explain this phenomenon, typical of the atmosphere following 1968? The arguments (certainly passionately debated) advanced by the tenants of “leftist” data analysis were of two sorts. On the one hand, the analysis was supposedly neutral, with no ideological bias. On the other hand, it was multidimensional.
First and foremost, correspondence analysis was seen as a purely descriptive technique (unlike econometrics), with no underlying, implicit economic/theoretical model: free of the ideologically slanted neo-classical theory. It was supposed to permit one to separate – without any a priori ideology – the fundamental structures buried in an opaque mountain of data. Many said that the idea, fueled by Benzecri, was simplistic because the choice of variables and nomenclatures used in the analytical tables already implied a hypothesis, if not a model. Still, the tool was presented in these terms by its supporters, in explicit opposition to Popperian epistemology, as descriptive exploratory analysis rather than causal analysis bolstered by a predetermined model.
Furthermore, in the wake of 1968, its multidimensionality seemed to be proof of pluralism and democracy, and not simply one-dimensional and reductive (the famous wage scale so dear to economists) – the latter two both synonyms for monotony and hierarchy. Herbert Marcuse’s precisely titled One-Dimensional Man, one of the epoch’s cult books, appeared in 1968 with its vigorous criticism of consumer capitalism. This multidimensionality allowed an understanding of class conflicts more subtle than the proletarian/bourgeoisie split, all while still maintaining the central character of the latter.
The adversaries of this viewpoint traditionally point out that technical tools are without political or ideological tendency, and that mathematical formalism (diagonalization of variance-covariance matrices, eigenvalue and eigenvector searches) is the same for correspondence analysis as well as for the solving of econometric models with simultaneous equations. But even if the mathematical syntaxes of these two tools are related, their semantics are as different as one can imagine: on the one hand, there’s the sociological critique Bourdieu, and on the other, there are the econometric models of government advisors, which focus on action and decision.
…sets the stage for social a bi-dimensional cartography…
Bourdieu and his disciples put all this to spectacular use starting in 1975, especially in the book La distinction: Critique sociale du jugement. In it, Bourdieu analyzed the tastes and cultural behaviors of the French according to an elegant nomenclature of “socio-professional” groups, which included over thirty positions and which had been used by l’INSEE (French Statistical Institute) since the 1950s for its censuses and research. The interest of this list iwas that it produced much more complex distinctions than those obtainable with the one-dimensional scale of Anglo-American sociology of yore (upper-class, middle-class, lower-class). Correspondence analysis produced graphic representations structured along “factorial axes” created from data research tables (or matrices).[2]
The first axis, taking into account a maximum of information (or “variance”) contained in this table, pitted, as expected, the leisure classes against the lower classes. But the second axis (orthogonal to the first and retaining all the variance not explained by it) showed contrasts that were much less evident a priori (yet with a notably inferior “explained variance,” thus maintaining the hegemony of the opposition of the lower-class). Along this second axis, two other categories were contrasted in probability, to use Bourdieu’s words. One category was designated “cultural capital” (teachers, artists, researchers, salaried public employees with degrees – mostly urban), and the other was called “economic capital” (employers, merchants, artisans, farmers, salaried workers in private enterprises – more often rural). Thus, at a given level in the Anglo-American scale (for example “the middle-class”), clear distinctions arise in terms of cultural practices, residential neighborhoods, and voting patterns.
The mapping of the social world proposed by Bourdieu in La distinction comes in part from correspondence analyses done on data from a number of statistical investigations. Its second axis, contrasting portions of class in terms of cultural capital and economic capital, is relatively stable. It has been upheld by various other studies on consumer practices, on marriage, on the distribution of residential territory in big cities, and on voting patterns. This last example is very telling, for only the bi-dimensional representation allows an accounting of the surprising differences between on the one hand, results of presidential and parliamentary elections, and on the other, votes on the referendum for the European Union in 1992 and 2005.
…that makes evident certain peculiarities in electoral behavior.
In 1970, Benzecri had himself applied correspondence analysis to the voting results of twenty Parisian arrondissements in the 1969 presidential election. Two classic right-wing candidates, Georges Pompidou and Alain Poher, faced off against a communist, Jacques Duclos, two representatives from the intellectual left, Michel Rocard and Alain Krivine, and a candidate who represented small business owners, Louis Ducatel. The first axis classically set Pompidou and Poher against Duclos, the bourgeois neighborhoods against the working class boroughs. But the statistician Benzecri, in delicious fashion, anticipating what would later constitute the second axis in Bourdieu’s celebrated schema in La Distinction, commented thusly on the results of the second axis of his correspondence analysis:
“On the second axis, we believe it is possible to recognize some common distinctions. Politically, it’s Rocard, supported by middle-class intellectuals living in the 6th arrondissement, against Ducatel, whose fiefdom is comprised of another middle-class of artisans and small merchants active between the former Les Halles and the Bastille. On one side are neighborhoods that, while not strictly residential, still possess few workshops and businesses; on the other side, a picturesque maze straight out of Hausmann leading perhaps all the way to Rungis… On the political map, arrondissements 5, 6, 13, 14 and 15 are alone above the first axis, with Rocard and Krivine…” (Benzecri, 1970).
The same bi-dimensional mapping of social categories shows itself to be relevant to the interpretation of differences between traditional political elections and the two referendums concerning the European Union in 1992 and 2005. A map of the results of the 1973 legislative elections, done with surveys indicating the social category of the voters, was published in 1975. Following the first axis from top to bottom (presented vertically), there are five parties. Left-wing voters are cleverly represented on the left of the schema, and right-wing voters to the right. Independent Republicans (the bourgeois right of Valéry Giscard d’Estaing) are on top, in the zone for liberal professionals and high-ranking executives. Below that, on the same vertical and near the center of the image, is the Center (Christian Democrats). The UDR (the Gaullist party) is at the same level as the Center, but more to the right, near the “non-salaried” pole of the second axis. The Socialist Party (that of François Mitterrand) is lower down and clearly to the left, on the side of the mid-ranking executives, while the Communist Party is even lower down, in the worker’s zone.
This configuration is a model of classic electoral sociology. However, the bi-dimensional representation allows for a more subtle analysis. The two big political groups, the right and the left (whose vote was split almost equally between Giscard d’Estaing and Mitterrand in 1974), are split on the schema not with a horizontal line, but by a “second bisector” (NW – SE). The Giscard d’Estaing voters are (in probability) more or less upper-class and non-salaried (merchants, artisans, and employers – the categories designated as economic capital). Mitterrand voters are laborers, employees, and the salaried middle-class, notably teachers (categories designated as cultural capital). The National Front, Jean-Marie Le Pen’s populist party, did not yet exist. After becoming a significant political force in 1985, it complicated the schema, finding itself socially more or less in the southeast quadrant of the graph, in the non-salaried, lower and middle-class zone, with voters situated rurally or in small towns.
Thirty years later, this means of representing social space would allow for illuminating clarifications about the voting process in both European referendums: the 1992 Maastricht Treaty and the 2005 European Constitution Project. These elections left the adherents of old school electoral sociology quite disconcerted, because the social groups were not distributed in the same manner as in traditional elections that pit right against left. For these referendums, it’s the “first bisector” (NE-SW), perpendicular to the previous one, which distinguishes (in probability) the yes and no voters. In both referendums, the upper classes, urban university graduates, and salaried public employees voted yes more often than the lower classes and the small business owners. This was clear from the surveys done in 1992 and 2005.
Over the last two decades, methods called data mining have been developed. They are used primarily in marketing, to differentiate categories of clientele, or to “profile” future delinquents. French data analysis like Benzecri’s correspondence analysis is the ancestor of more recent tools, regardless of the fact that Benzecri and Bourdieu surely had no inkling of its future applications in business and policing. These descriptive and classifying methods are different tools in inferential statistics, used especially in econometrics and more generally in hypothetical-deductive scientific procedures. Their flexibility is what makes them unique, permitting a back and forth between individuals and their respective regroupings. This flexibility is clearly of paramount importance in both profiling and in the recent explosion of database use, themselves both byproducts of the new information and communication technology developed since 1990.
The history of statistical methods has always been plagued by a tension between the aims of pure knowledge and social criticism on the one hand, and practical application in the fields of social governance or commerce on the other. This being said, Benzecri’s data analysis and more recent methods of data mining cover the entire spectrum, from the most radical criticism up to and including political and commercial endeavors. It is also another and more serious way to pose that naïve question of the 1970s: is correspondence analysis leftist or rightist?
Translated by